01 — The problem
Small-business owners make pricing and hiring decisions on stale quarterly accountant updates and tangled spreadsheets. By the time margins drop, the damage is already done — a supplier raises prices, a product loses money for weeks, and nobody notices.
02 — My approach
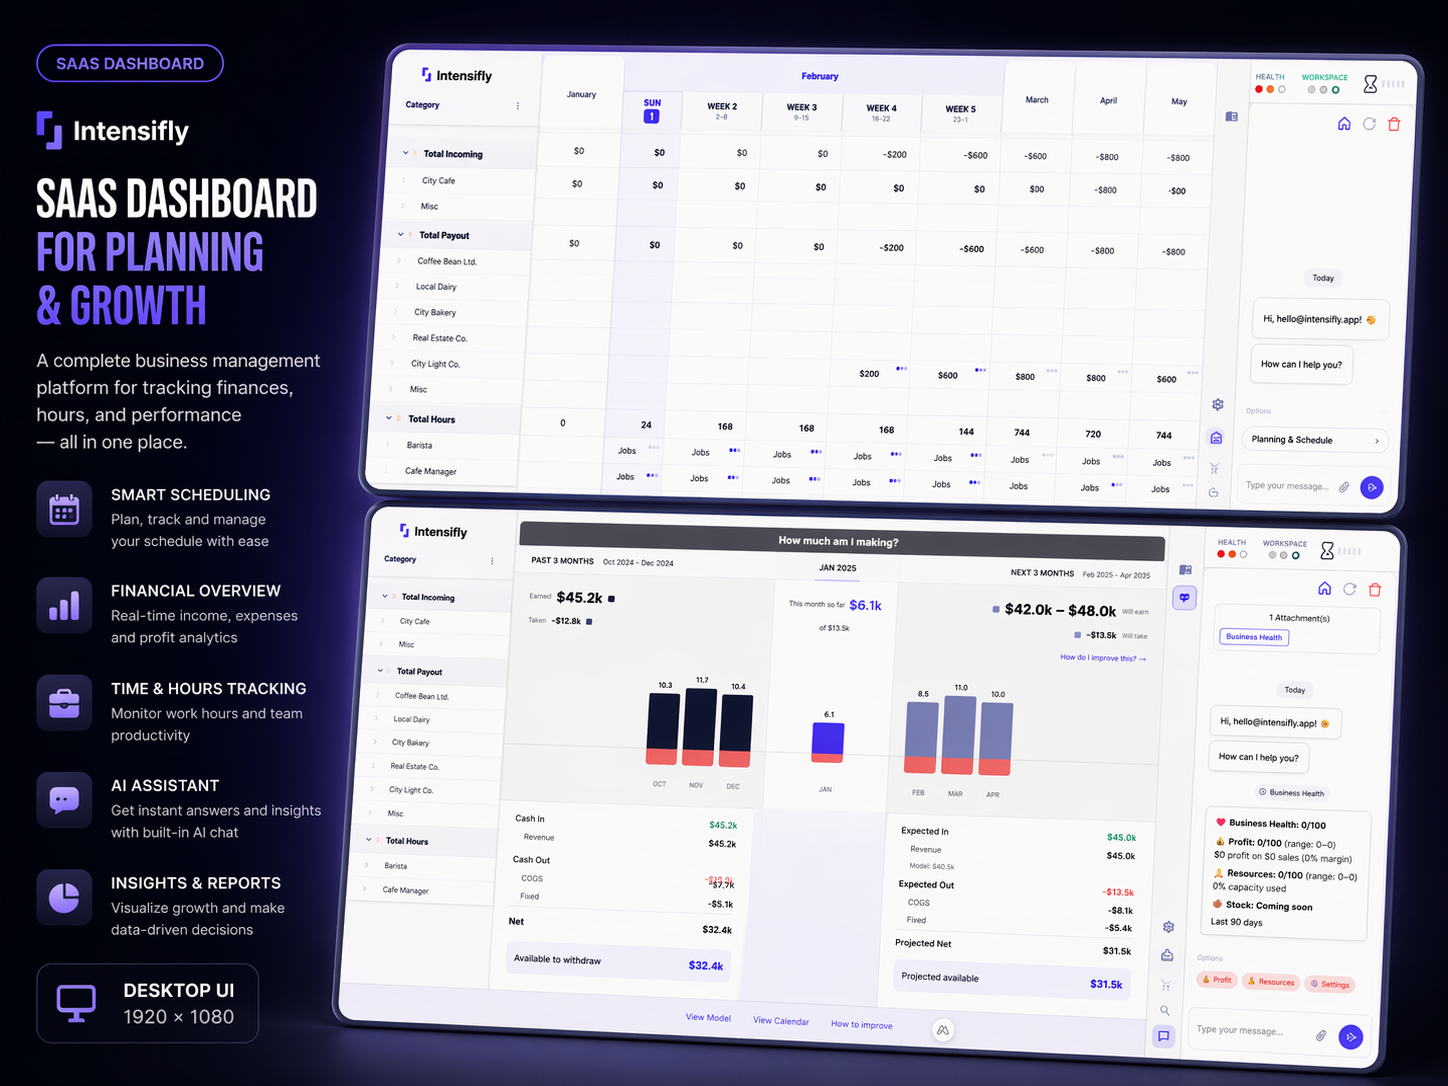
I designed a Nuxt 3 + TypeScript SaaS that distills the business into three indicators: Earning Power (operating profit), Owner Capacity (cash available), and Trust (alignment, confidence, coverage). One weekly loop — See → Understand → Fix — replaces the spreadsheet model. Cashflow calendar, per-product cost breakdowns, AI assistant for what-if scenarios, industry templates for cafes, dental clinics, farms, auto workshops, rentals, and bakeries.
03 — The result
Operators open the dashboard once a week, see a traffic-light health score, and act before margins evaporate. "Easier than a spreadsheet. Harder to get wrong."
Key highlights
- Three-indicator Profit Health Score (Earning Power, Owner Capacity, Trust)
- Cashflow calendar (past + next 30 days)
- AI assistant for what-if scenarios and reports
- Per-product and per-service cost / margin breakdowns
- Industry templates for 7+ verticals
- Docker-based self-hostable deployment